Overview
Creating high-fidelity synthetic point clouds from 3D models is a crucial skill for anyone working in fields like computer vision, robotics, or environmental simulations. In particular, SpeedTree models, widely used in the film, gaming, and virtual reality industries, offer a rich source of detailed vegetation models that can be leveraged for this purpose.
While SpeedTree is not primarily designed for scientific applications, and there is no native support to simply export a point cloud of a tree, this tutorial bridges that gap. I've developed Python libraries specifically to adapt SpeedTree's capabilities for scientific use. These tools allow you to extract detailed point cloud data from SpeedTree models, making the software a valuable resource for generating synthetic datasets in research and development contexts.
Synthetic point clouds provide a way to generate large datasets without the need for labor-intensive manual annotations or the complexities of real-world data collection. These point clouds are essential for training and testing machine learning models, especially in scenarios where acquiring real-world data is challenging or impractical.
This tutorial will guide you through my synthetic tree point cloud creation process, enabling you to create your own synthetic datasets with high precision and detail, ready for various research and development tasks.
Prerequisites
To follow along with this tutorial, you'll need a few essential tools and resources:
SpeedTree Access: You will need access to the SpeedTree software, which can be obtained here. This tutorial uses a tree model that comes bundled with SpeedTree, but depending on your needs, you may want to make your own tree or purchase a species-specific model from the SpeedTree store. The process we'll cover applies to any tree model, so feel free to use one that suits your project.
.spm File: Ensure you have a .spm file, which is the file format used by SpeedTree to store tree models. This file will be the starting point for transforming your tree into a synthetic point cloud.
Python Packages: You'll also need to download and install the Python packages I've developed and uploaded to my GitHub repository. These packages are specifically designed to interface with SpeedTree files, extracting and processing the data needed for generating high-fidelity point clouds.
Part 1: Creating a High-Fidelity Tree Model
Visualizing Point Cloud Fidelity within SpeedTree
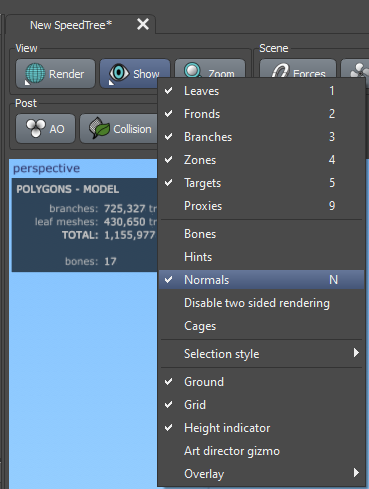
Enable Normals in the Viewing options
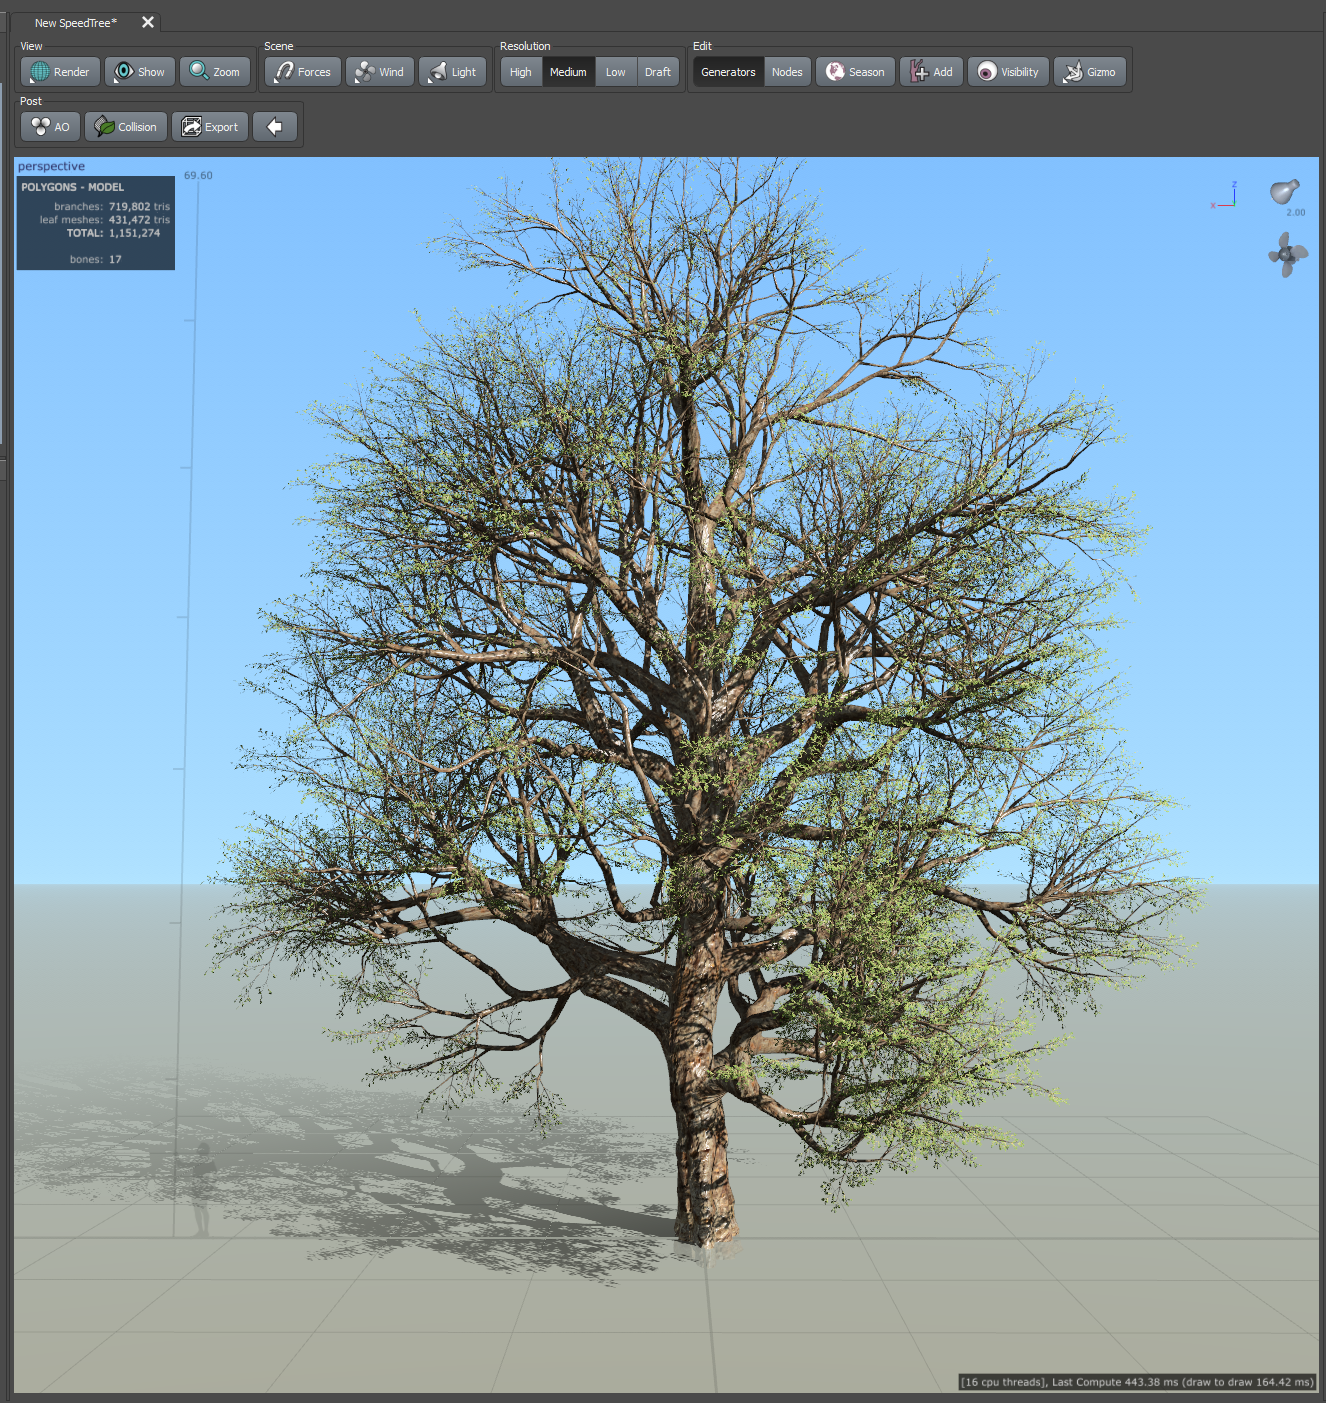
Step 1: Launching SpeedTree and Opening Your .SPM File
To begin, launch SpeedTree and open the.spm file of the tree model you'd like to transform into a point cloud. The first step is to assess the surface normals of your model, which are crucial for determining the fidelity of the resulting point cloud. Surface normals give you an insight into how finely detailed your point cloud will be since the vertices of your model will be treated as points in the point cloud.
Step 2: Viewing Surface Normals
To visualize the surface normals follow these steps:
Accessing Normals: In the toolbar at the top, click on the "Show" button, then select "Normals" from the dropdown menu. This action will enable the visualization of surface normals on your model.
Checking for Changes: If you don't notice any immediate changes, don't worry. The surface normals will become visible when you click on a Generator within the Generator Editor. Each Generator produces nodes, and the surface normals for these nodes will be displayed, giving you a clear view of the model's vertex distribution.
The more vertices your model has, the more polygons it contains, and subsequently, the more surface normals will be present. This density is directly related to the granularity of your point cloud—more vertices mean a higher fidelity point cloud. Ensuring your model is sufficiently detailed at this stage is critical for achieving a high-quality point cloud later in the process.
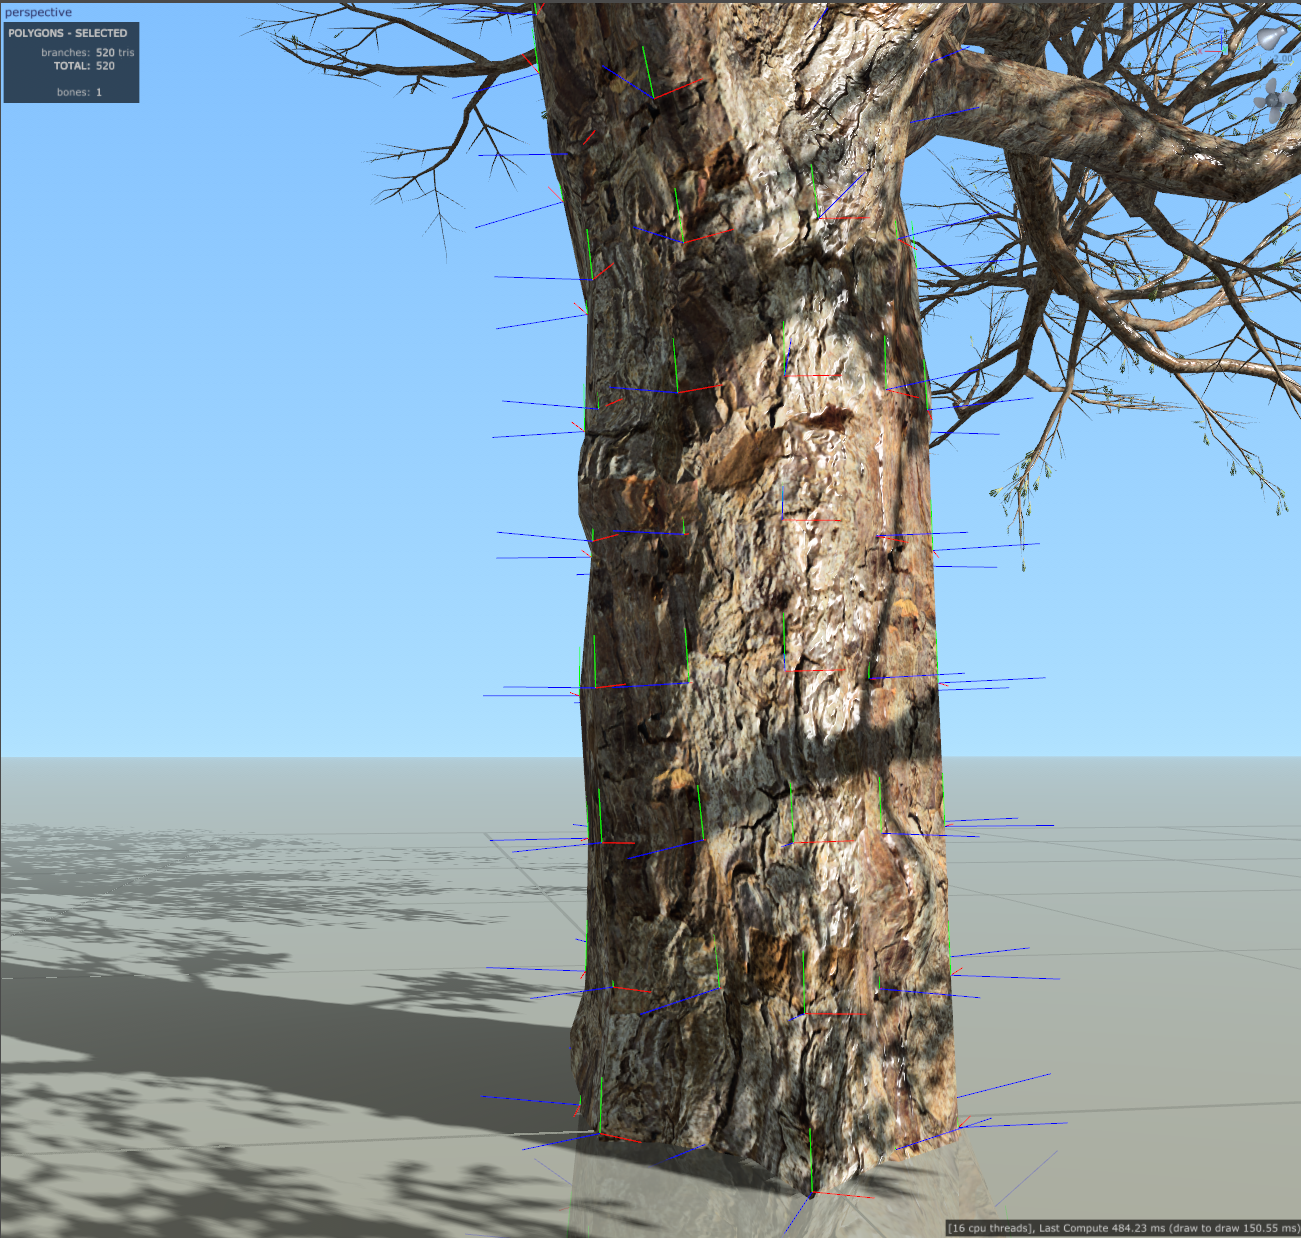
Example of a tree with low surface normal count on the Trunk
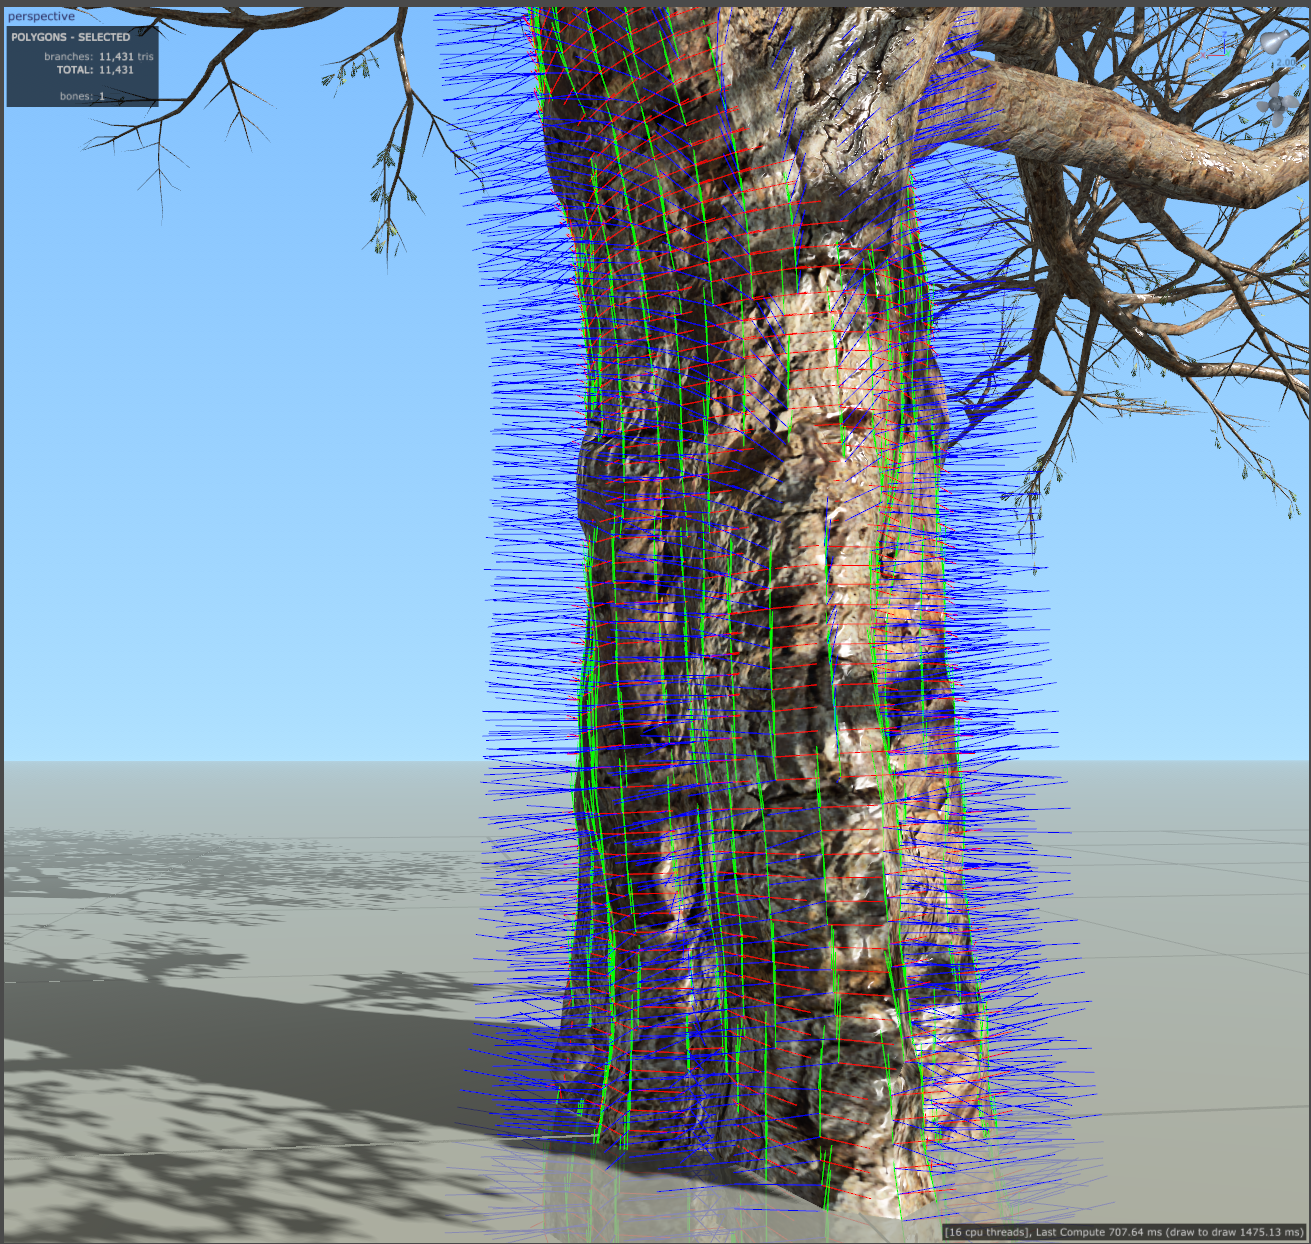
Example of a tree with high surface normal count on the Trunk
Optimizing Surface Normals for Higher Fidelity
To increase the number of surface normals on your tree model, you can make several adjustments that enhance detail without drastically altering the tree's structure or species characteristics. Here’s how you can do it:
Step 1: Adjust Segment Length and Radial Settings
Select the Generator: Start by selecting the Generator you want to enhance. Generators control different parts of the tree, like branches, leaves, or the trunk. For most trees, the branch generators will be a significant focus since they form the bulk of the structure.
Increase Segment Length:
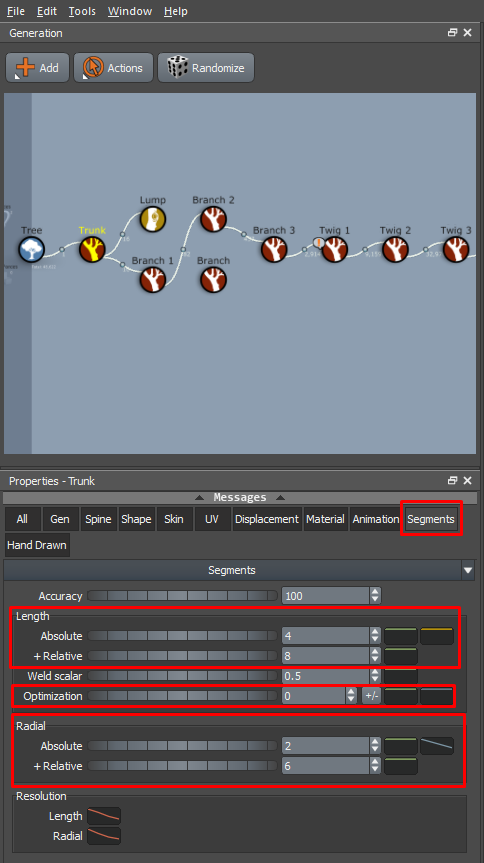
Go to the Segments tab in the properties window.
For branches, increase the values under Segments > Length > Absolute or Segments > Length > +Relative.
This will increase the number of segments along the length of the branch. Imagine a cylinder (the branch): as you increase these values, more segments are added along its length, making the surface more detailed. More segments mean more vertices, and consequently, more surface normals.
Increase Segment Radial:
In the same Segments tab, increase the values under Segments > Radial > Absolute or Segments > Radial > +Relative.
This will add more 'radial' segments around the circumference of each branch segment.
Disable Optimization:
SpeedTree has an optimization feature that reduces unnecessary segments to streamline the model. To maximize detail, set Optimization to zero. This ensures all potential surface normals are retained, rather than being removed by the algorithm.
Step 2: Fine-Tune Distribution Settings
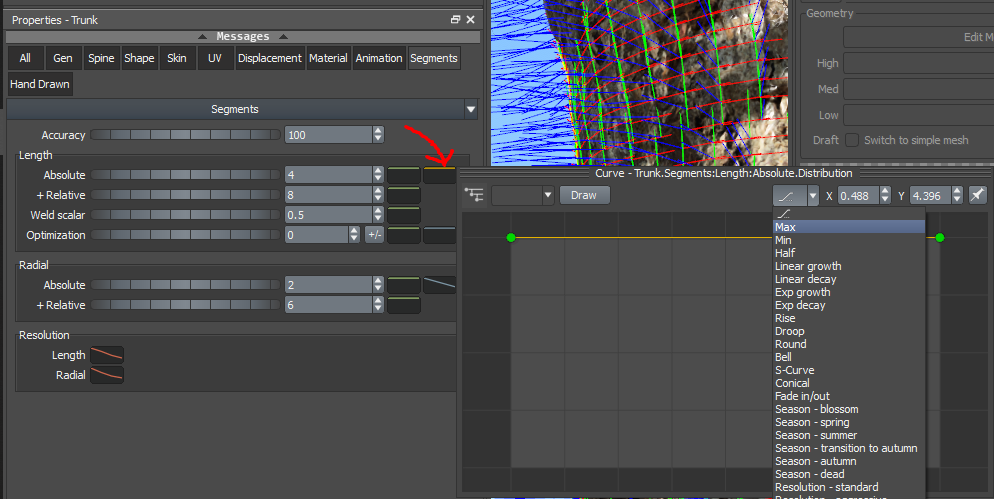
Maximize Segment Distribution:
In the Segments tab, locate the yellow Distribution line next to Segments > Length > Absolute.
Click on this line, and from the dropdown, select Max. This will clip the yellow line to the top of the curve, ensuring that the maximum number of segments (and thus surface normals) is consistently applied throughout the length of each segment.
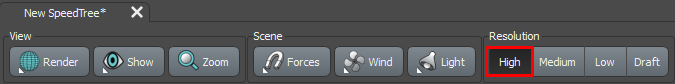
Set Model Resolution to High:
Finally, ensure that the Overall Model Resolution is set to High. This setting maximizes the detail level across the entire model, ensuring your point cloud captures as much information as possible.
By following these steps, you’ll increase the surface normals on your tree model, which directly translates to a higher fidelity point cloud. This process is pretty similar for the other Generator types such as Cap, Knot, and Shell. For a list of all Generator types, look at SpeedTree's documentation.
Adjusting Vertex Count for Leaf, Batched Leaf, and Frond Generators
Unlike branches, Leaf Mesh, Batched Leaf, and Frond Generators operate differently because they are mesh-based objects. Instead of occupying 3D space like branches, these elements are 2D images that give the appearance of leaves or fronds. Due to their mesh-based nature, you won’t find the same segment options available for increasing surface normals. Instead, you’ll need to increase their vertex count through a different method.
Step 1: Accessing the Materials Asset Tab
Open the Materials Asset Tab:
If the Materials Asset tab isn’t visible, you can open it using the shortcut Alt + W + A + M.
This tab allows you to select and modify the mesh associated with your leaves, fronds, or batched leaves.
Select the Leaf Mesh:
From the dropdown menu in the Materials Asset tab, select the mesh that your leaves use. This will load the specific mesh that defines the shape and structure of the leaves in your model.
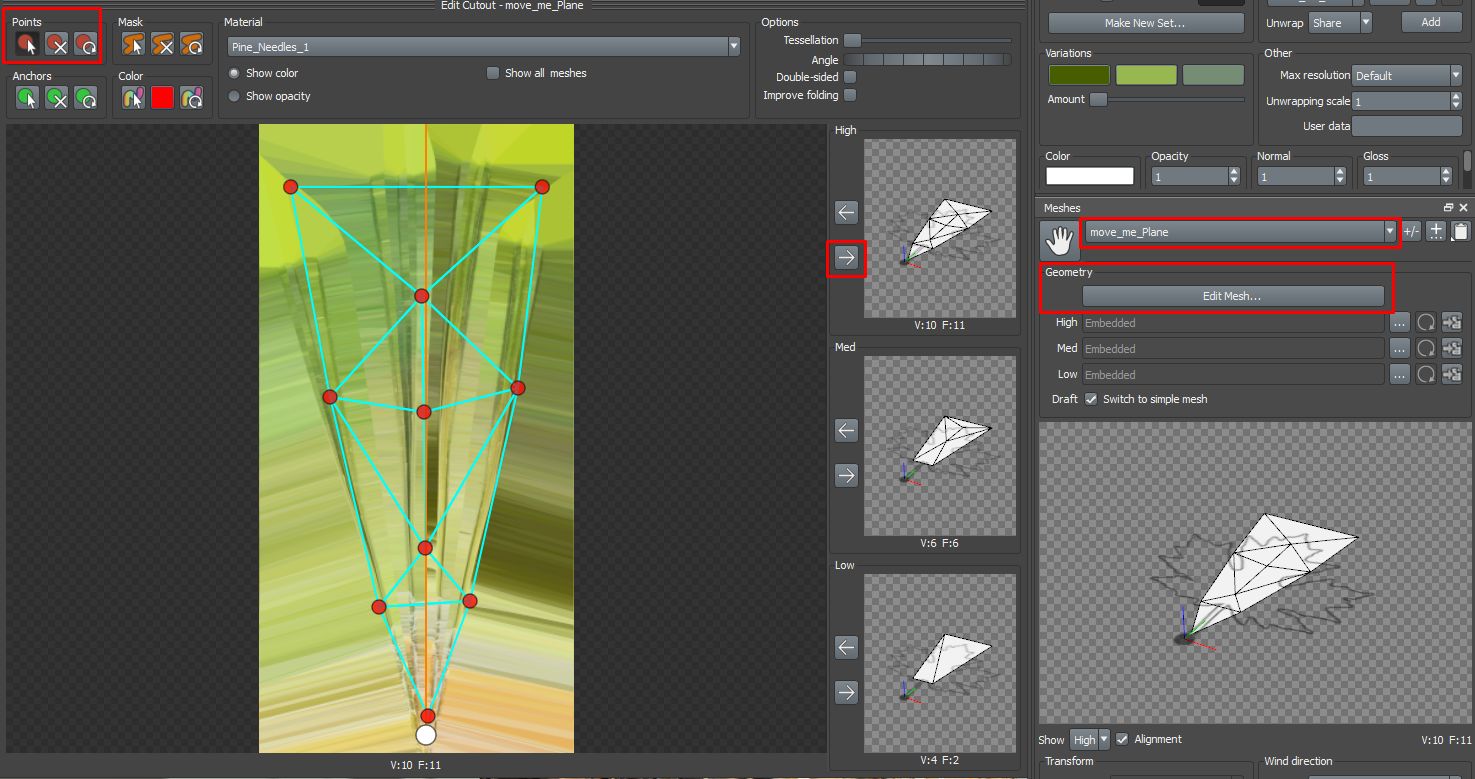
Step 2: Editing the Leaf Mesh
Edit the Mesh:
Under the Geometry section, click Edit Mesh. This will open a cutout screen displaying the vertices of the selected mesh.
Here, you can manually add or remove vertices and adjust their positions. Each vertex you add increases the level of detail for each individual leaf, which can enhance the overall fidelity of your point cloud.
Caution: Be mindful of the overall vertex count. Adding too many vertices can drastically increase the number of triangles (tris) in your model, potentially making it overly complex and resource-intensive.
Apply the Changes:
Once you’re satisfied with your edits, look to the right side of the window where you’ll see a box labeled High.
Click the right-facing arrow next to this box to apply your changes over to the High Resolution version of your tree model. This ensures that your edits are reflected in the most detailed version of the model, which is what you’ll be using to generate your point cloud.
By carefully adjusting the mesh vertices, you can optimize the level of detail in your leaves, fronds, and batched leaves, enhancing the overall quality of your synthetic point cloud without compromising the performance or structure of your model.
Finalizing Your Model for Point Cloud Export
By now, your tree model should be highly detailed, with a significant number of triangles (tris) contributing to its complexity. For generating a dense and high-fidelity point cloud, I typically aim for models with over 800,000 tris. This level of detail provides excellent coverage of points, ensuring that the resulting point cloud captures the intricate features of the tree.
Balancing Fidelity and Practicality
In a machine learning context, models are often constrained by the dimensionality of the input space, with point clouds typically being downsampled to 2048 points. Given that you'll likely be repeating this process for multiple trees, and considering that your models will be subsampled during training, it's essential not to go overboard with model fidelity. While high-fidelity models are nice for certain applications, such as visualizing model inference, keep in mind that models with over a million points can quickly consume significant storage space. Therefore, I recommend reserving ultra-high-fidelity models for specific cases where the added detail truly matters.
Preparing for Point Cloud Export
Before exporting your model as a point cloud, there are a few critical steps to ensure it’s correctly parsed, particularly if you plan to utilize my Python packages for generating point clouds with per-point categorical information.
Generator Renaming for Classification:
My parser can categorize points based on the generator they originate from, which is vital for tasks like tree part-segmentation. The primary categories are typically the stem (trunk), woody branches, and live branches (like leaves).
To facilitate this classification, you'll need to rename the Generators according to the following schema:
Stem (Trunk): Rename any Generators associated with the trunk to include the word 'trunk'. This includes any associated features like knots, lumps, or cavities. Ensuring they all contain 'trunk' in their name helps the parser accurately classify these points.
Live Branches (Leaves): For points that should be classified as live branches, ensure that the Generator names include 'lea' (to catch both 'leaf' and 'leaves').
Woody Branches: Any Generators that don't match the stem or live branch criteria will be automatically classified as woody branches.
By renaming your Generators according to this structure, you enable the parser to correctly assign each point in the cloud to its respective category.
Exporting the Tree Model as an XML File
Once you've completed all the adjustments and renaming, the final step is to export your tree model as an.xml file. This format allows for flexible use across various applications, including those that might not natively support SpeedTree models.
Step 1: Exporting the Model
Export as XML:
Press Ctrl + E to bring up the export options.
In the dropdown menu, select SpeedTree Raw XML.
This export option is designed by SpeedTree to maximize compatibility, making it easier to integrate their models into a wide range of applications.
Step 2 (Optional): Understanding the XML Format
Documentation Reference: The details of the custom XML format used by SpeedTree can be found on their documentation page.
Part 2: From Model to Point Cloud
Using the Code to Export Your SpeedTree XML Object to an H5 Point Cloud File
In this section, we’ll walk through the process of converting your exported SpeedTree.xml file into a high-fidelity.h5 file containing the nx4 point cloud.
High-Level Overview of the Parser
The core functionality of the parser is to extract the geometric data from the SpeedTree XML file and organize it into a point cloud format. The point cloud data is stored as an nx4 matrix, where each point in the cloud consists of its X, Y, Z coordinates and a class label indicating whether the point belongs to the trunk, branches, or leaves of the tree.
Here's a breakdown of how the parser works:
XML Parsing with pyxmltree.py:
The TreeNode class is the fundamental building block that represents each node (part of the tree structure) in the XML file. It extracts and stores the XYZ coordinates of the points, along with their absolute positions.
The get_tree_pointcloud function categorizes nodes into three primary groups: trunk, branches, and leaves, based on the naming conventions of the Generators you've set up in SpeedTree. This categorization is essential for assigning class labels later in the process.
The get_pointcloud_from_xml function aggregates all the points into separate lists for the trunk, branches, and leaves, making them ready for conversion into a unified point cloud.
Conversion to H5 Format with batch_convert_to_json.py:
The create_h5_pcd_from_speedtree_xml function is where the conversion happens:
First, it uses xml_to_pointcloud_array to combine the XYZ coordinates from the trunk, branches, and leaves into a single NumPy array. Each point is also labeled with a class: 0 for trunk, 1 for branches, and 2 for leaves.
The function then optionally subsamples the point cloud if you want to reduce the number of points for memory or processing efficiency.
Finally, save_pointcloud_to_h5 saves this structured point cloud data into an HDF5 (.h5) file, under a single dataset labeled pointcloud.
Step-by-Step Guide to Exporting the Point Cloud
Prepare Your Environment:
Ensure you have the necessary Python packages installed, including h5py and numpy, which are essential for handling the data and creating the.h5 files.
Run the Conversion:
With your.xml file exported from SpeedTree, you can use the provided script to convert it into a point cloud stored in an.h5 file. For example:
This command will generate a point cloud from your XML file and save it to the specified HDF5 file. If you need to subsample the point cloud, you can pass the max_subsample_amt parameter to limit the number of points.
Final Output:
The resulting .h5 file will contain your tree model's point cloud data in an nx4 matrix, ready for use in various applications, including machine learning and 3D visualization.
Verifying and Visualizing Your Point Cloud
After converting your SpeedTree XML to an H5 point cloud, you’re almost done! The final step is to verify and visualize the results to ensure everything worked as expected. You can do this using a script I’ve provided in the Visualization_Notebooks folder. Here’s how:
Step 1: Open the Visualization Notebook
Navigate to the Folder:
Open the Visualization_Notebooks folder in your project directory.
Launch the Notebook:
Open the visualize_h5_pointcloud.ipynb notebook. This Jupyter notebook is pre-configured to load and display your point cloud data.
Step 2: Run the Notebook
Run Both Cells:
The notebook contains two cells that you’ll need to run. The first cell loads the point cloud data from the .h5 file, and the second cell visualizes it.
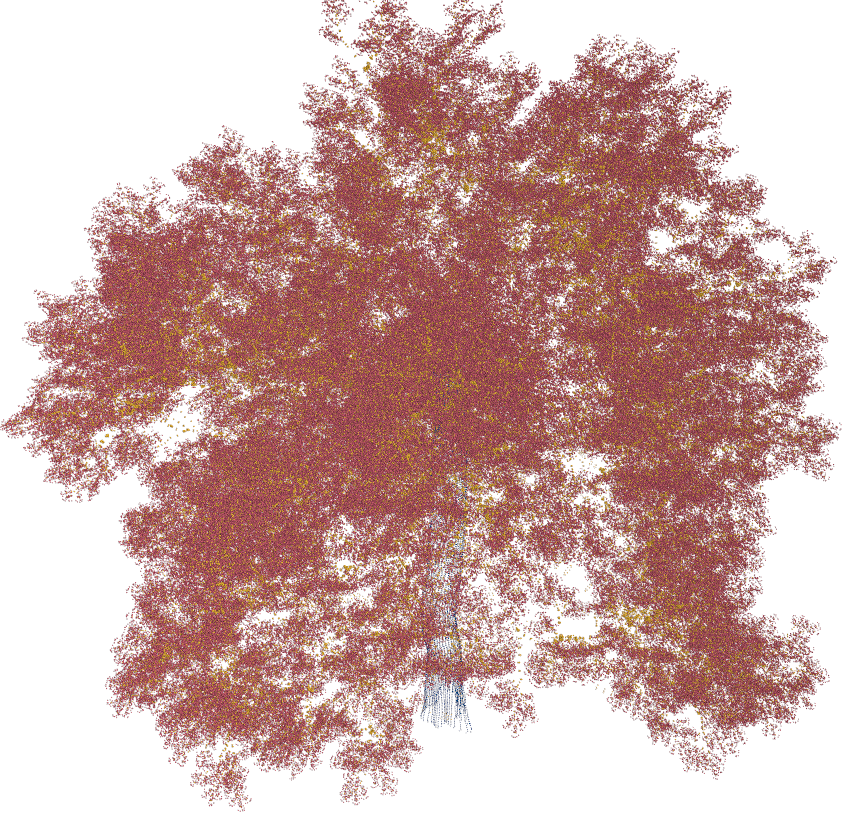
Visualize the Point Cloud:
After running the cells, you should see the point cloud rendered in the Mayavi window. The points will be color-coded based on their classification (e.g., trunk, branches, leaves), allowing you to visually inspect the distribution and density of points.
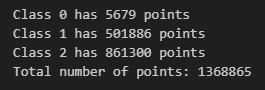
Check the Distribution:
The notebook will also print out the distribution of points across the different classes (trunk, branches, leaves). This output helps you verify that the classification and conversion processes were executed correctly.
Here’s a summary of what each part of the code does:
Loading the H5 File: The load_h5_pointcloud function reads the point cloud data from your .h5 file.
Visualizing the Point Cloud: The visualize_pointcloud function uses Mayavi to render the point cloud. It color-codes the points according to their class labels, making it easy to distinguish between different parts of the tree.
Printing Class Distribution: The print_class_distribution function provides a breakdown of the number of points in each class, helping you ensure that the point cloud is well-balanced and accurately represents the original model.
By following these steps, you can visually confirm that your point cloud was generated correctly and gain insights into the distribution of points across the tree’s different components.
I like to use this step as an opportunity to ensure the quality of the point cloud. This is where I can visually inspect the model to check if I’ve properly adjusted the surface normals during the earlier steps. For instance, I want to make sure I didn’t overlook increasing the surface normals for any specific Generator, which could result in areas of the model being under-detailed.
Alternatively, I might notice that I’ve gone overboard with the surface normals for a particular Generator, resulting in an overly dense point cloud in one part of the model compared to others. In such cases, I can go back and make adjustments to achieve a more balanced and consistent level of detail across the entire tree.
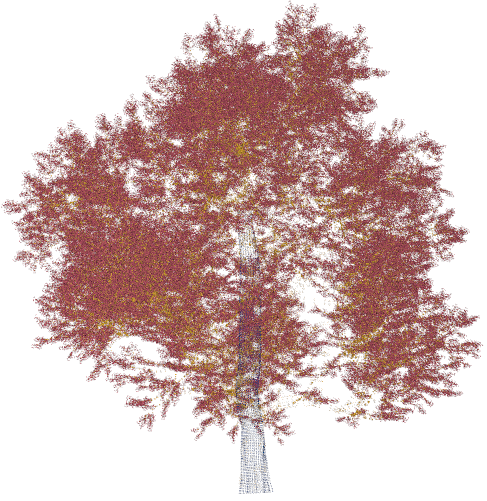
In the example screenshots below, I can clearly see that my trunk class is largely underrepresented. If I wanted to fix this point cloud, I could go back and either increase fidelity of the trunk or decrease fidelity levels of branches and leaves.
Conclusion
Congratulations! You’ve successfully transformed a detailed SpeedTree model into a high-fidelity synthetic point cloud, ready for use in scientific analysis or machine learning applications. Through this tutorial, you’ve learned how to optimize your model by adjusting surface normals, export the tree model as an XML file, and convert that data into an H5 format containing the point cloud.
You also took the crucial step of visualizing the point cloud to verify its quality, ensuring that all parts of the model are appropriately detailed and balanced. This process not only enhances the accuracy of your point cloud but also prepares your data for more advanced applications, such as part-segmentation or training machine learning models.
Thank you for following along, and I hope this tutorial helps you in your future projects! If you have any questions or run into any issues, feel free to reach out.